
Many Malaysian small business owners I speak with tell me the same thing: "We know we should be using data, but we don't have a data team, a budget for Tableau, or even the time to figure it out." The truth is, you don't need any of that. Business analytics for SMEs is not about complex machine learning models or multi-million ringgit dashboards. It's about consistently measuring a handful of key performance indicators (KPIs) that directly impact your bottom line.
Let's look at the six most actionable KPIs that any SME can start tracking this week — no data team required.
1. Gross Profit Margin
This is the single most important number in your business. It tells you how much money you actually keep after paying for the cost of goods sold (COGS). For a retail shop, that means the cost of buying inventory. For a restaurant, it's the cost of ingredients and packaging. The formula is simple: (Revenue − COGS) ÷ Revenue × 100. Track this monthly. If your margin is trending downward, it's time to review your pricing or suppliers.
Tools: Google Sheets or any free accounting software. Most POS systems also calculate this automatically if you set up your cost prices correctly.
2. Customer Acquisition Cost (CAC)
How much do you spend to get one new customer? Add up all your marketing and sales costs for a month — ads, promotions, salaries of sales staff — and divide by the number of new customers acquired in that period. If you spent RM 5,000 on Facebook ads and gained 100 new customers, your CAC is RM 50.
3. Customer Lifetime Value (CLV)
CLV estimates the total revenue a customer will generate over their entire relationship with your business. Calculate it by multiplying the average purchase value by the average purchase frequency per year, then multiply that by the average customer lifespan (in years). Ideally, your CLV should be at least three times your CAC. If it's lower, you're spending too much to acquire customers who don't stick around.
4. Inventory Turnover Ratio
This KPI is critical for retail and F&B SMEs. It tells you how many times you sell and replace your inventory over a period — typically a year. A low turnover means you're holding onto stock that isn't moving, tying up cash that could be used elsewhere. To calculate it: Cost of Goods Sold ÷ Average Inventory Value.
If your turnover ratio is below 4 for retail or below 12 for fresh food, you have too much dead stock. Use this data to run promotions on slow-moving items or adjust your ordering quantities.

5. Net Promoter Score (NPS)
NPS measures customer loyalty with a single question: "How likely are you to recommend our business to a friend or colleague?" Customers rate on a scale of 0–10. Promoters (9–10) are your loyal fans. Detractors (0–6) are at risk of churning. Subtract the percentage of detractors from promoters to get your NPS. Anything above 50 is excellent. Send a simple Google Form or WhatsApp message to customers after their purchase to collect this data.
6. Monthly Recurring Revenue (MRR) — For Subscription Businesses
If your SME runs on a subscription model (SaaS, membership boxes, retainer services), MRR is your North Star KPI. It's simply the total predictable revenue you collect each month. Track MRR growth rate month over month. If it's flat or declining, dig into churn (customers leaving) or downgrades.
For non-subscription businesses, track average transaction value (ATV) instead: total revenue ÷ number of transactions. Increasing ATV by even RM 2–3 per transaction can significantly boost your monthly revenue.
How to Build a Simple KPI Dashboard
You don't need a data team to set this up. Here's a five-step plan:
- Open Google Sheets or Microsoft Excel — both are free for basic use.
- Create a new tab for each KPI listed above.
- Add a column for each month — start with the last six months.
- Plug in the numbers from your POS, accounting software, or bank statements.
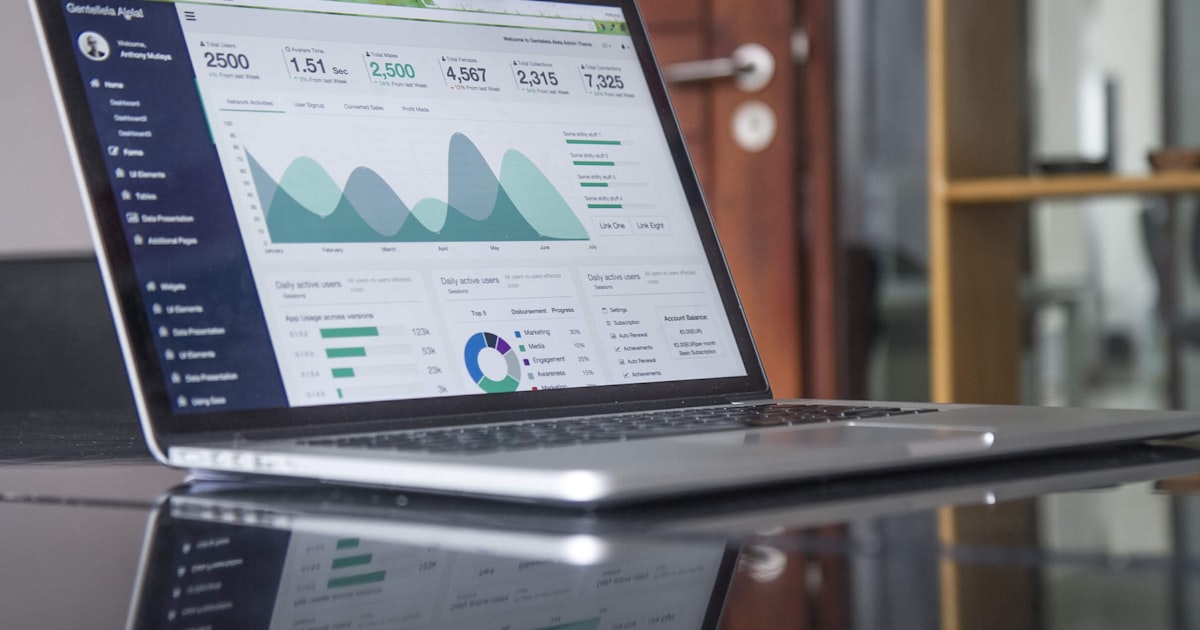
- Add sparklines (mini line charts) to visualise the trend at a glance.
Set a recurring reminder on your phone — every first Tuesday of the month, spend 30 minutes updating your sheet. After three months, patterns will emerge. After six months, you'll be making better business decisions instinctively.
Choosing the Right Tools
Google Sheets and Excel will get you 80% of the way there for free. If you want something more automated, consider these affordable options:
- Zoho Analytics: Starts at RM 100/month. Pre-built connectors for POS systems, accounting software, and e-commerce platforms.
- Databox: Free tier available. Pulls data from Google Analytics, Facebook Ads, and Stripe into one dashboard.
- Power BI: Free desktop version. More powerful but has a steeper learning curve.
- Your POS System: Most modern POS systems (Square, KORONA, Shopify) include built-in analytics dashboards. Start there before buying anything extra.
Conclusion
Business analytics doesn't have to be intimidating or expensive. By tracking just six KPIs — gross profit margin, CAC, CLV, inventory turnover, NPS, and MRR — you gain visibility into the health of your SME that most business owners lack. The key is consistency, not complexity. Start small, pick two or three KPIs that matter most to your industry, and build from there. Within a quarter, you'll have data-driven insights that help you cut waste, improve customer retention, and increase profitability — all without a data team.
Frequently Asked Questions
Gross profit margin and inventory turnover should be reviewed monthly. CAC and CLV are fine on a quarterly basis. NPS works well measured monthly for businesses with high transaction volumes, or quarterly for lower-volume businesses.
It helps, but it's not essential. Many KPIs can be calculated from your POS reports, bank statements, and sales invoices. Google Sheets or Excel is perfectly adequate for starting out.
Bad data is still useful data. A declining gross profit margin tells you to review pricing or suppliers. A low NPS tells you to focus on customer service. The goal is awareness, not perfection.
Partially. Google Sheets can pull data from Google Analytics and Google Ads for free. Some POS systems offer API access, but you may need a developer to set up the connection. For full automation, budget at least RM 100–200 per month for a tool like Zoho Analytics or Databox.
Business Analytics Without a Data Team: KPIs Every SME Can Track Today